|
10 August 2018 last updated |
 |
| Retirement income hits ten year high rising 37% since Brexit vote |
 |
Retirement income from a pension fund has recovered to the highest level since the financial crisis rising 37% from the recent low after Brexit due to strong equity markets and higher annuity rates.
For people remaining invested by tracking the FTSE-100 index before retirement and buying an annuity, there is the prospect of receiving the highest retirement income seen since July 2008 following the financial crisis.
For our index we use the benchmark example of a 65 year old with a fund of £100,000 in July 2008 where income levels reached a recent low after the Brexit vote in August 2016 of £5,885 pa and have since increased to £8,066 pa in July 2018.
The combination of recovering Annuity rates and high equity markets has seen retirement income rise 37.0% in the last two years and is the highest level during the last ten years.
annuity rates have increased from the all time low of £4,696 pa two years ago to the current level of £5,633 pa.
|
|
 |
| |
Rising equities and annuities sends retirement income to a 10 year high and 37% up since Brexit |
|
|
|
| |
|
Retirement income at a 10 year high
Income you can receive from a pension depends on the growth in equity markets while accumulating your funds and annuity rates when you take your benefits. By combining both these elements we can show the buying power of a £100,000 fund over time in relation to the July 2008 starting point.
Following the Brexit vote the FTSE-100 index has increased 14.2% from 6,781 in August 2016 to 7,748 in July 2018. Over this time annuity rates have recovered 19.9% from £5,885 pa to £8,066 pa.
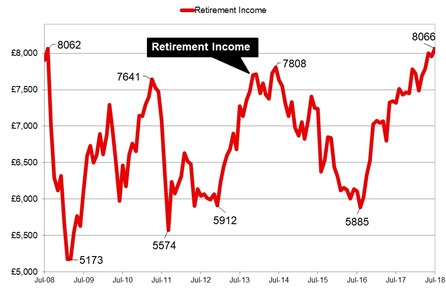 |
| Fig 1: Chart comparing retirement income since July 2008 |
The above index chart shows retirement income is based on a 65 year old with £100,000 invested in a fund that tracks the FTSE-100 index and buying a single life, level annuity.
In July 2008 a fund of £100,000 had the buying power to provide an income of £7,908 pa and this reduced to only £5,173 pa by February 2009, the lowest in the last ten years.
The buying power increased to
£7,808 pa in June 2014 before reducing to a low point in August 2016 of £5,885 pa following the Brexit vote when annuity rates reached an all time low.
| |
Benchmark annuity rates and FTSE-100 index |
|
| |
Jan |
Feb |
Mar |
Apr |
May |
Jun |
Jul |
| FTSE |
7,671 |
7,175 |
7,398 |
7,509 |
7,678 |
7,636 |
7,748 |
| Rate |
£5,546 |
£5,645 |
£5,626 |
£5,613 |
£5,639 |
£5,639 |
£5,633 |
|
The above table shows we have entered a period of stability for people buying annuities during a buoyant equity market, although a rise or fall in equities can make a significant difference to the income they can expect.
Although annuity rates are 28.7% lower since July 2008, the FTSE-100 index has increased 43.1% and this would benefit those investing in flexi-access drawdown.
Since the Brexit vote retirement income has recovered 37.0% or for our benchmark example an increase of £2,181 pa. Over the lifetime of the annuitant based on the Office of National Statistics (ONS) we would expect a male to live for 18.5 years. This would mean he will have £40,348 more over his lifetime and for a female she can expected to live for 20.9 years increasing her income by £45,582.
For those that remain invested before take their benefits as an annuity this could be a good time as combination of annuity rates and equity markets maintain high levels.
|
| |
|
 |
|
|
|
|
|
| |
Age |
Single |
Joint |
|
 |
| |
55 |
£6,132 |
£5,784 |
|
|
| |
60 |
£6,532 |
£6,234 |
|
|
| |
65 |
£7,247 |
£6,808 |
|
|
| |
70 |
£8,170 |
£7,616 |
|
|
£100,000 purchase, level rates, standard
Unisex rates and joint life basis |
|
|
|
|
 |
| |
Plan your annuity and get quotes from the 12 leading providers |
|
| |
| |
 |
Free Annuity Quotes |
| |
|
No Obligation |
| |
|
From All Providers |
|
|
|
|
|
|
 |
|
|
| You can follow the latest annuity updates on Twitter or as a fan on Facebook |
 |
| |
 |
 |
|
|
|